Abstract
Edge computing networks need to dynamically distribute their limited and heterogeneous computation resources to handle changing tasks efficiently.
Extended Report
This page distills the local PDF into an accessible web report with paper-grounded tables, extracted figures, reusable links, and explicit data provenance notes.
Research Summary
The report keeps the paper’s own language wherever practical, then adds structure around the algorithm, experiment design, and reported outcomes.
Edge computing networks need to dynamically distribute their limited and heterogeneous computation resources to handle changing tasks efficiently.
Tables
The first table is loaded from the shared JSON extracted from the local PDF. The allocation and performance tables are reproduced directly as web-readable summaries.
| Platform | Ubuntu 22.04 on Intel Core i7-12700 CPU with 32 GB RAM |
|---|---|
| Trials | 20 randomized runs per scenario |
| Nodes | 5 heterogeneous edge nodes |
| Tasks | 12 computational tasks |
| Demand classes | Small (2-5), Medium (6-10), Large (11-15) |
| Task | Demand | Class |
|---|---|---|
| Loading task data. | ||
| Node | Static first-fit | Auction-based |
|---|---|---|
| Node A | T1, T2, T4 | T2, T7, T10 |
| Node B | T3, T5, T6 | T1, T4, T12 |
| Node C | T7, T8 | T3, T8, T11 |
| Node D | T9 | T5, T9 |
| Node E | T10, T12 | T6 |
| Unallocated | T11 | — |
| Metric | Static | Auction |
|---|---|---|
| Resource utilization rate | 89.4% | 98.2% |
| Task assignment rate | 91.7% | 100% |
| Residual fragmentation | 10.6 units | 1.8 units |
| Fairness index | 6.4 | 3.2 |
| Tasks successfully placed | 11/12 | 12/12 |
Figures
The extracted figures preserve the paper’s own presentation while the Plotly charts below re-express the underlying variables for easier exploration on the web.
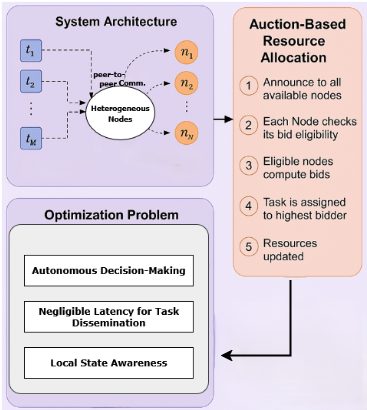
The original figure shows the system architecture, optimization framing, and the auction steps from announcement to resource updates.
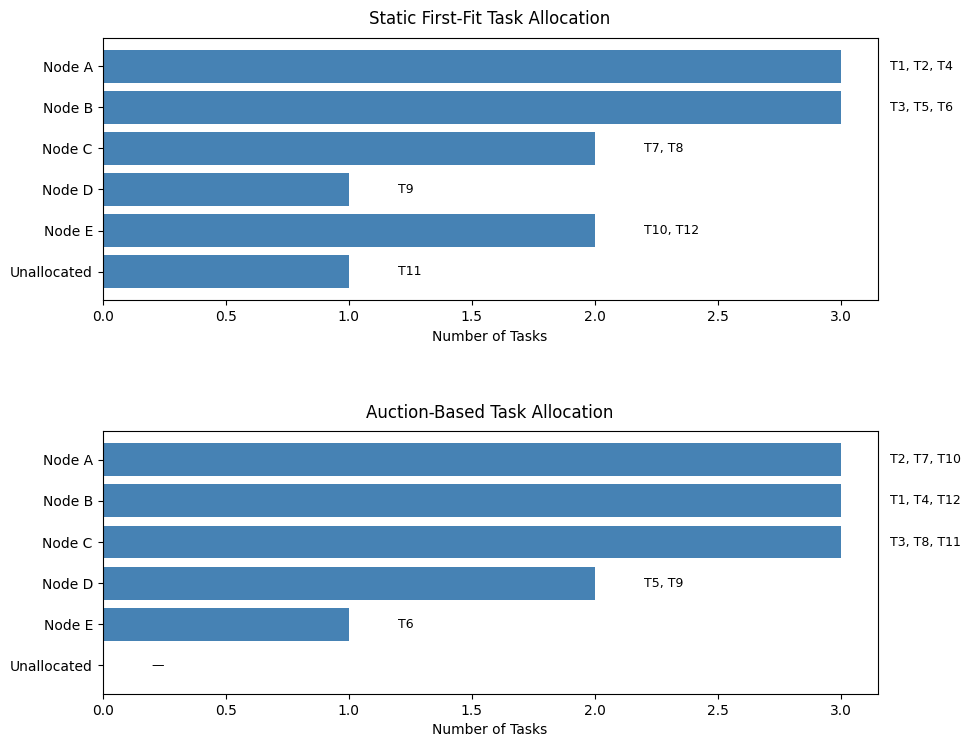
Representative run showing how task distribution differs between static first-fit and auction-based assignment.
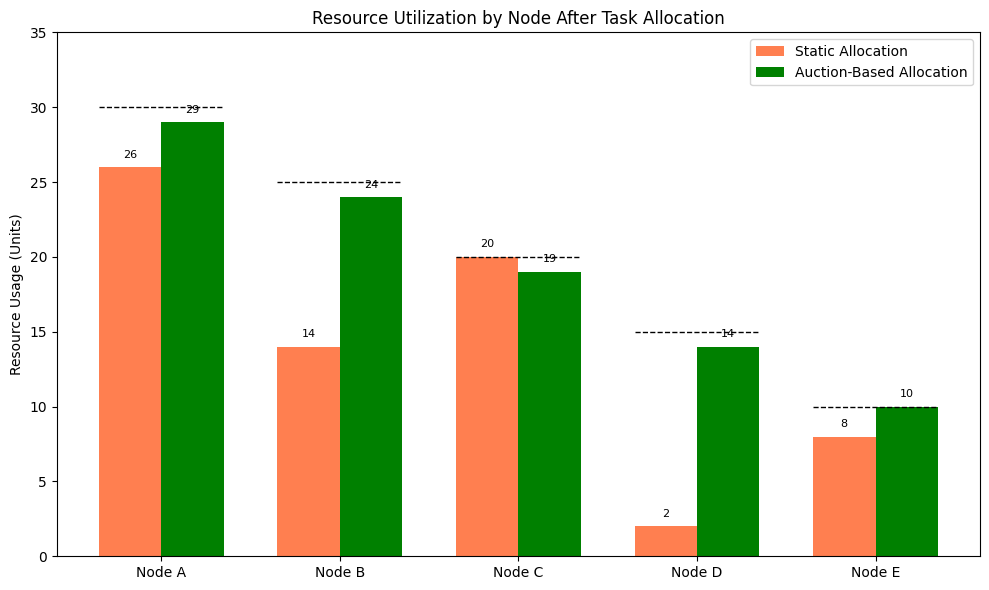
The auction strategy spreads work more evenly across nodes in the representative figure.
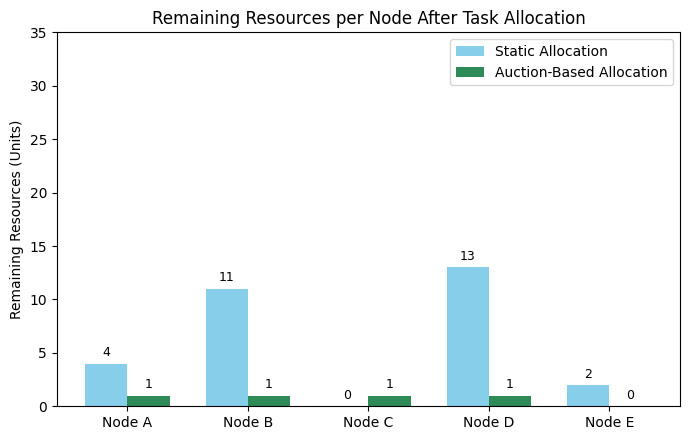
Residual capacity becomes less fragmented under the auction-based strategy, which is why large tasks are less likely to be rejected.
Citation
The BibTeX entry below is included so the repository can be cited directly from the report page without opening the PDF first.
Loading citation.